阅读本文需要对Prometheus及相关组件有所了解,请先熟悉之前的教程。
在学习Prometheus Operator前,我们有必要先来了解一下:什么是Operator?
当在Kuberentes平台上部署和管理某些复杂应用时,往往会面临不少挑战。
为了简化这个过程,CoreOS公司推出了Operator的概念,这可以理解为是一种自动化的部署与管理工具。
Operator可扩展 Kubernetes API,通过自定义资源(CRD)来封装对于应用的管理方法,从而实现软件配置的代码化管理。
Prometheus Operator顾名思义是针对Prometheus及其相关组件的管理工具,通过对其有效使用,可实现监控系统的快速搭建和高效管理。
本文将为你介绍相关的使用方法。
部署Prometheus Operator
Prometheus Operator对Kubernetes的版本有所要求,需要不低于1.16.x。
$ git clone https://github.com/coreos/prometheus-operator.git

$ cd prometheus-operator
$ kubectl  create -f bundle.yaml

# 查看服务实例状态,已部署完成
$ kubectl get pod
NAME                                  READY   STATUS    RESTARTS   AGE
prometheus-operator-98d4cf976-djvvr   1/1     Running   0          15m
Operator的部署非常简单,在创建完成后,我们可以开始来部署应用服务。
在Prometheus Operator创建的自定义资源(CRD)中,与Prometheus相关资源的主要有以下几种:
- Prometheus
- ServiceMonitor
- PodMonitor
- PrometheusRule
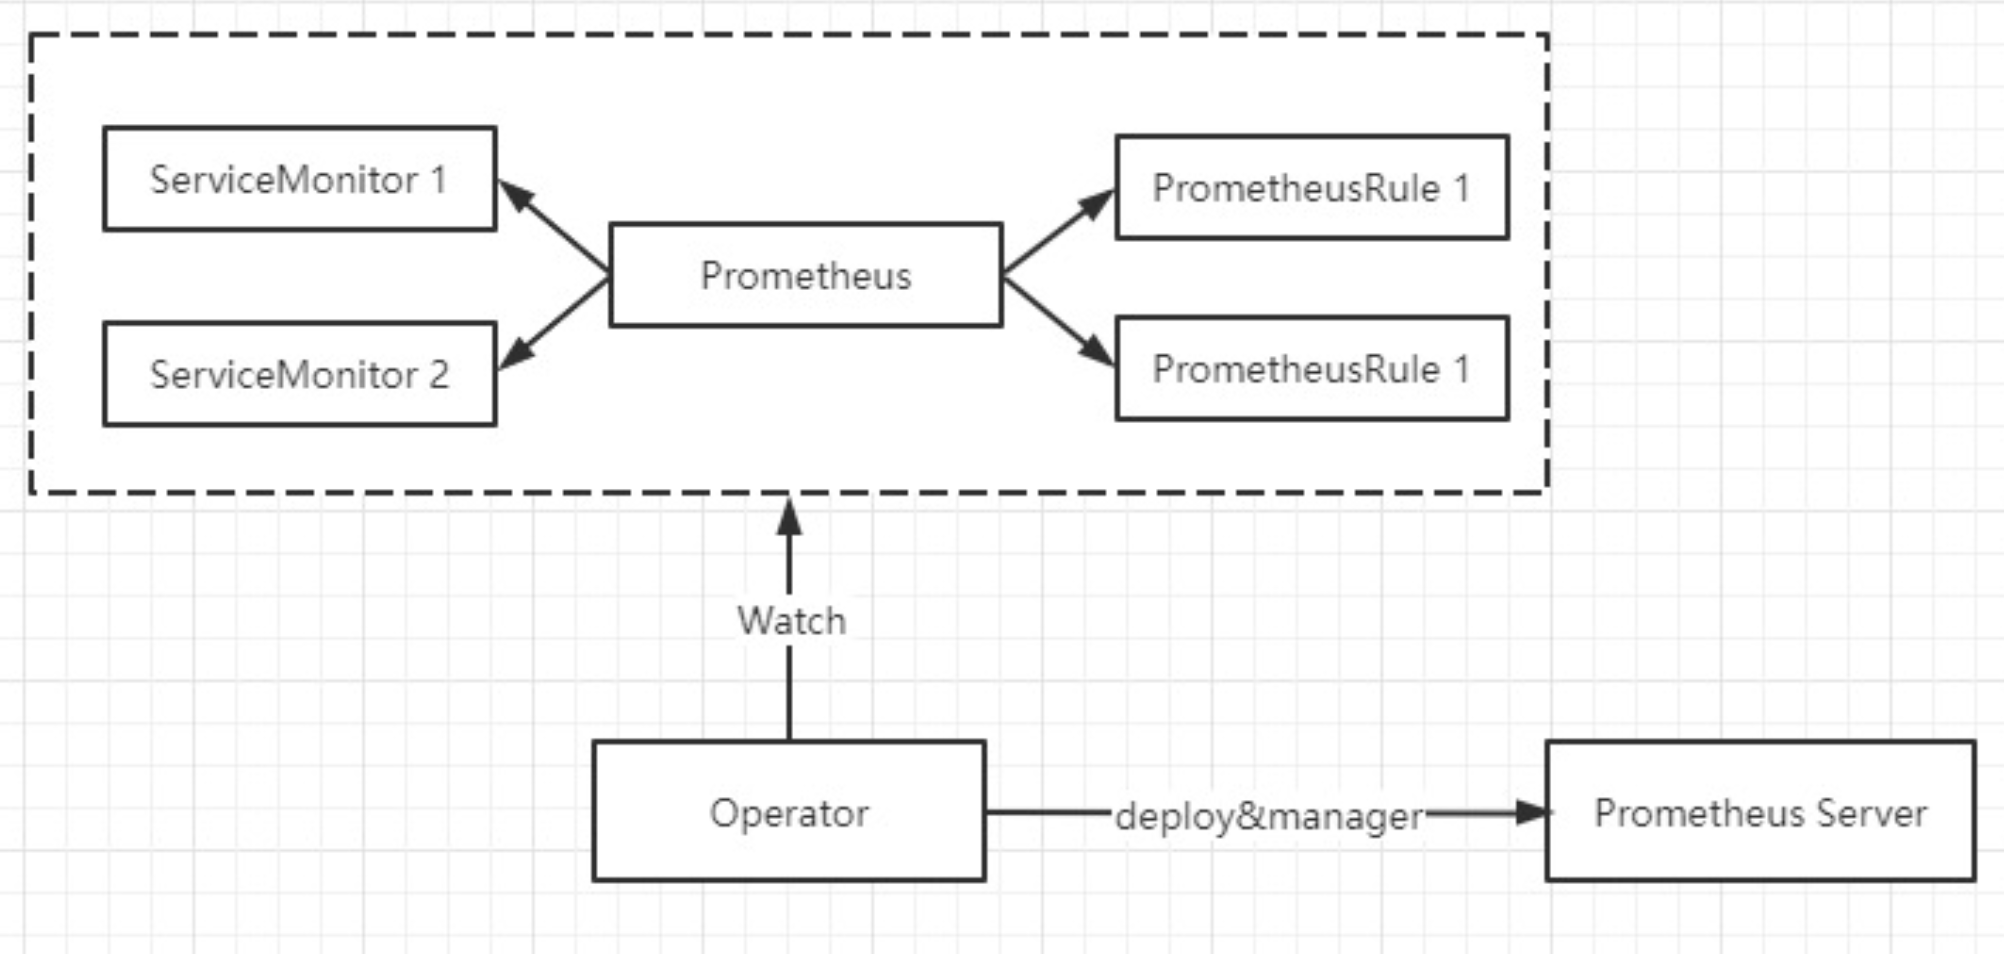
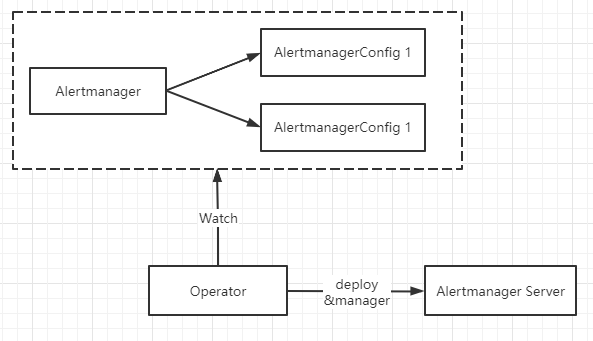
其中Prometheus资源用于声明Prometheus的部署,ServiceMonitor 和 PodMonitor用于配置监控任务,而PrometheusRule则用于告警规则配置。 如下图所示,Operator将会监测相关对象资源的变动,并根据资源设置对Prometheus Server进行管理
部署Prometheus
下面,我们先来部署Prometheus实例,这里需创建一个Prometheus资源。
- 创建namespace。
$ kubectl create ns demo
- 配置RBAC授权。 创建SA
apiVersion: v1
kind: ServiceAccount
metadata:
  name: prometheus
  namespace: demo

# 创建集群角色

apiVersion: rbac.authorization.k8s.io/v1
kind: ClusterRole
metadata:
  name: prometheus
rules:
- apiGroups: [""]
  resources:
  - nodes
  - nodes/metrics
  - services
  - endpoints
  - pods
  verbs: ["get", "list", "watch"]
- apiGroups: [""]
  resources:
  - configmaps
  verbs: ["get"]
- apiGroups:
  - networking.k8s.io
  resources:
  - ingresses
  verbs: ["get", "list", "watch"]
- nonResourceURLs: ["/metrics"]
  verbs: ["get"]

# 绑定账号
apiVersion: rbac.authorization.k8s.io/v1
kind: ClusterRoleBinding
metadata:
  name: prometheus
roleRef:
  apiGroup: rbac.authorization.k8s.io
  kind: ClusterRole
  name: prometheus
subjects:
- kind: ServiceAccount
  name: prometheus
  namespace: demo
将上面内容保存为yml格式文件,并执行。
$ kubectl apply -f rbac.yml
serviceaccount/prometheus created
clusterrole.rbac.authorization.k8s.io/prometheus created
clusterrolebinding.rbac.authorization.k8s.io/prometheus created- 部署prometheus实例,并指定匹配的ServiceMonitors。
prometheus.yml
apiVersion: monitoring.coreos.com/v1
kind: Prometheus
metadata:
  name: monitor
  namespace: demo
spec:
  serviceAccountName: prometheus
  serviceMonitorSelector:
    matchLabels:
      group: demo
  resources:
    limits:
      memory: 4Gi
    requests:
      memory: 0.5Gi
  enableAdminAPI: false
注释:此处匹配标签为“group: demo”的ServiceMonitors,符合该条件的ServiceMonitors配置会被获取。 默认情况下,Prometheus只会在当前namespace查找,如果需要从其他namespace选择,可以在spec中添加serviceMonitorNamespaceSelector字段。
将内容保存为yml格式文件,并执行 kubectl create -f prometheus.yml
查看prometheus服务,确认实例已正常启动。
$ kubectl get pod -n demo
NAME                      READY   STATUS    RESTARTS   AGE
prometheus-monitor-0 2/2 Running 0 17m- 配置prometheus service,并用nodeport的方式开放外部访问。
apiVersion: v1
kind: Service
metadata:
  name: prometheus
spec:
  type: NodePort
  ports:
  - name: web
    nodePort: 30900
    port: 9090
    protocol: TCP
    targetPort: web
  selector:
    prometheus: monitor
执行文件后,查看service已创建完成
$ kubectl get svc prometheus -n demo
NAME         TYPE       CLUSTER-IP      EXTERNAL-IP   PORT(S)          AGE
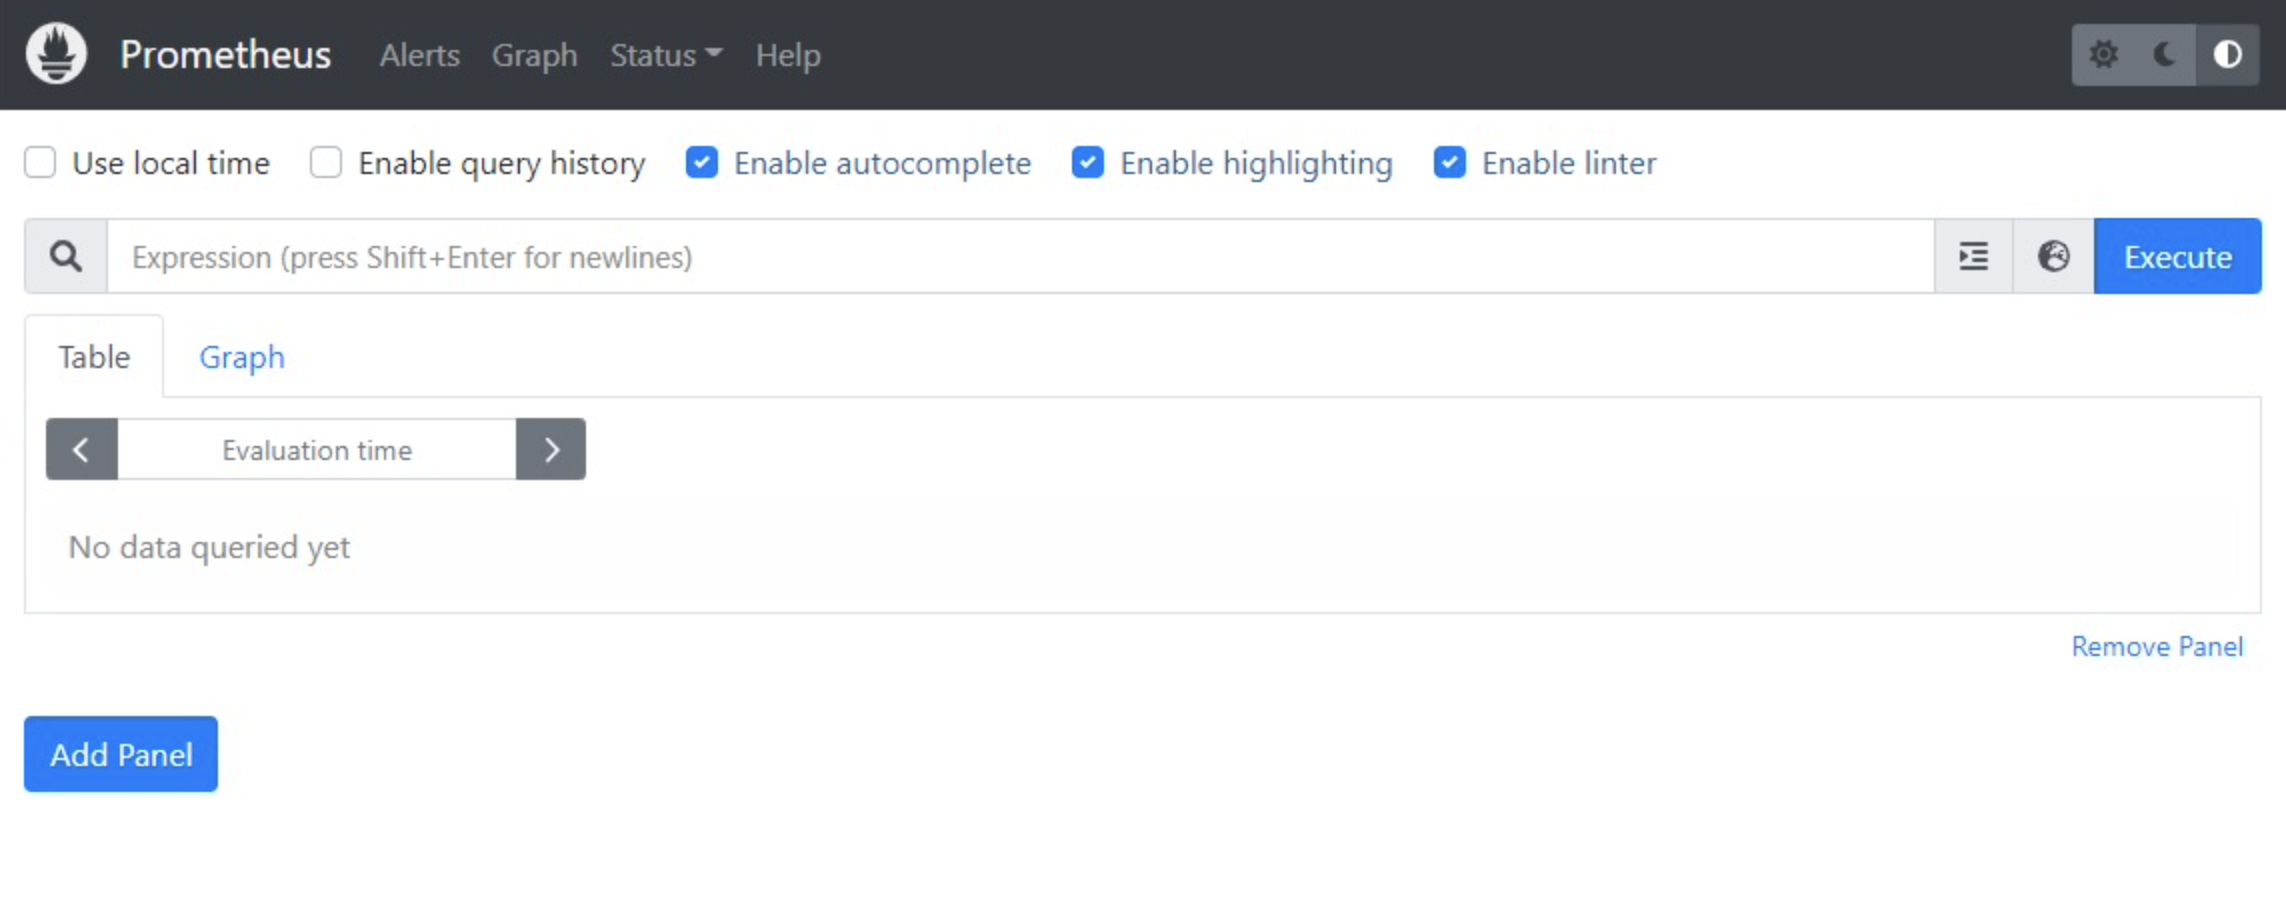
prometheus NodePort 10.220.105.76 <none> 9090:30900/TCP 13s- 此时,我们打开浏览器访问prometheus服务,正常情况下会看到系统已正常运行。
配置监控任务
在完成了Prometheus的部署后,下面我们来了解如何配置监控任务。
- 先部署一个测试服务example-app,用于验证功能。
apiVersion: apps/v1
kind: Deployment
metadata:
  name: example-app
  namespace: demo
spec:
  replicas: 3
  selector:
    matchLabels:
      app: example-app
  template:
    metadata:
      labels:
        app: example-app
    spec:
      containers:
      - name: example-app
        image: fabxc/instrumented_app
        ports:
        - name: web
          containerPort: 8080
---
kind: Service
apiVersion: v1
metadata:
  name: example-app
  namespace: demo
  labels:
    app: example-app
spec:
  selector:
    app: example-app
  ports:
  - name: web
    port: 8080
执行部署文件后,可看到相关的pod实例已正常运行。
$ kubectl get pod -l app=example-app  -n demo
NAME                          READY   STATUS    RESTARTS   AGE
example-app-bb759dfcc-4hfl4   1/1     Running   0          16m
example-app-bb759dfcc-9lmzt   1/1     Running   0          16m
example-app-bb759dfcc-wxgwq 1/1 Running 0 16m- 创建ServiceMonitor对象,用于监控该服务。
apiVersion: monitoring.coreos.com/v1
kind: ServiceMonitor
metadata:
  name: example-app
  namespace: demo
  labels:
    group: demo
spec:
  selector:
    matchLabels:
      app: example-app
  endpoints:
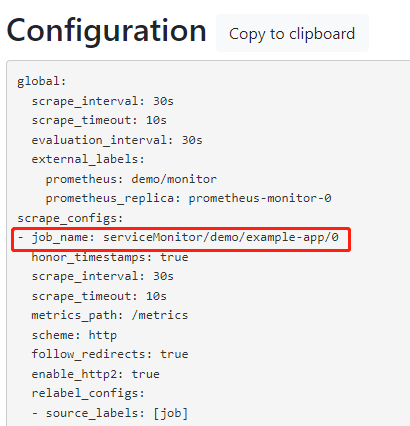
- port: web- 在前面的Prometheus配置中,我们已经配置自动关联标签为“group: demo”的ServiceMonitor。 现在,查看Prometheus 的configuration页面,可以发现已生成名为:serviceMonitor/demo/example-app/0 的监控Job。
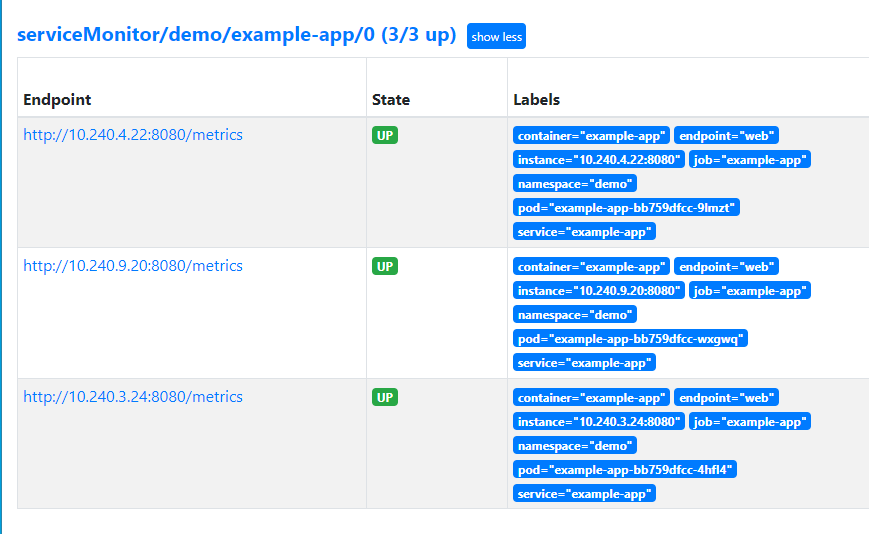
查看Targets页面,可看到example-app的相关实例已在监控中。
除了ServiceMonitor,还有PodMonitor也可以用于配置监控任务。两者的使用方法类似,PodMonitor主要用于Pod的服务发现,适用于对没有配置service的服务进行监控。限于篇幅原因,此处不展开细说,有兴趣的朋友可自行查看官网。
配置告警规则
现在,我们已配置好监控Job并完成了对目标的监控,接下来可以开始配置告警规则了。 告警规则使用PrometheusRule对象来进行设置。
- 创建PrometheusRule对象,并配置监控规则。
# demo-rule.yml
apiVersion: monitoring.coreos.com/v1
kind: PrometheusRule
metadata:
  labels:
    prometheus: example
    role: alert-rules
  name: prometheus-demo-rules
  namespace: demo
spec:
  groups:
  - name: demo.rule
    rules:
    - alert: up监控
      expr: up{job="example-app"} != 1
保存上面文件为yml格式,并执行。
- 此时需要修改prometheus配置,添加ruleSelector项,使其与PrometheusRule对象关联。
# prometheus.yml
apiVersion: monitoring.coreos.com/v1
kind: Prometheus
metadata:
  name: monitor
  namespace: demo
spec:
  serviceAccountName: prometheus
  serviceMonitorSelector:
    matchLabels:
      group: demo
  ruleSelector:
    matchLabels:
      role: alert-rules
      prometheus: example
  resources:
    limits:
      memory: 4Gi
    requests:
      memory: 0.5Gi
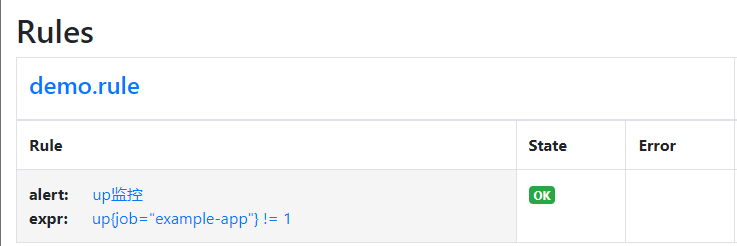
enableAdminAPI: false- 执行完成后,查看Prometheus的rules面板,可看到已自动生成相关的告警规则。
管理 Alertmanager
至此,我们完成了关于Prometheus的配置工作,包括创建实例、配置监控任务和告警规则。
当然,整个告警流程除了Prometheus以外,还离不开Alertmanager的支持。在这一点上,Prometheus Operator也可以帮助你实现。
在Prometheus Operator的自定义资源(CRD)中,与Alertmanager管理相关的资源有以下两种:
- Alertmanager
- AlertmanagerConfig 其中Alertmanager资源用于创建服务实例,AlertmanagerConfig则用于创建Alertmanager的配置。
创建Alertmanager实例
下面,我们来演示如何创建Alertmanager实例。
- 创建Alertmanager资源。
# alert.yml
apiVersion: monitoring.coreos.com/v1
kind: Alertmanager
metadata:
  name: alert
  namespace: demo
spec:
  replicas: 3
当replicas数量大于1时,Prometheus Operator会自动创建Alertmanager的集群。 查看状态,可看到实例已正常运行。
$ kubectl get pod -n demo |grep alertmanager
alertmanager-alert-0          2/2     Running   0          11m
alertmanager-alert-1          2/2     Running   0          11m
alertmanager-alert-2 2/2 Running 0 11m- 创建service对象,并用nodeport方式开放外部访问。
# alert-svc.yml
apiVersion: v1
kind: Service
metadata:
  name: alertmanager-alert
  namespace: demo
spec:
  type: NodePort
  ports:
  - name: web
    nodePort: 30905
    port: 9093
    protocol: TCP
    targetPort: web
  selector:
    alertmanager: alert
执行alert-svc.yml文件后,查看service可看到已创建完成。
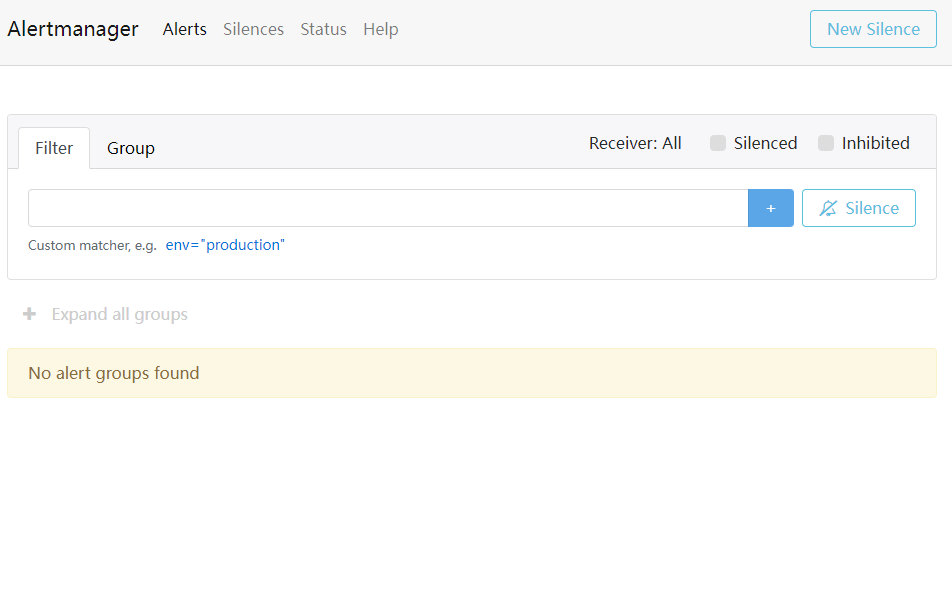
- 打开浏览器,访问alertmanager服务,可看到已正常启动。
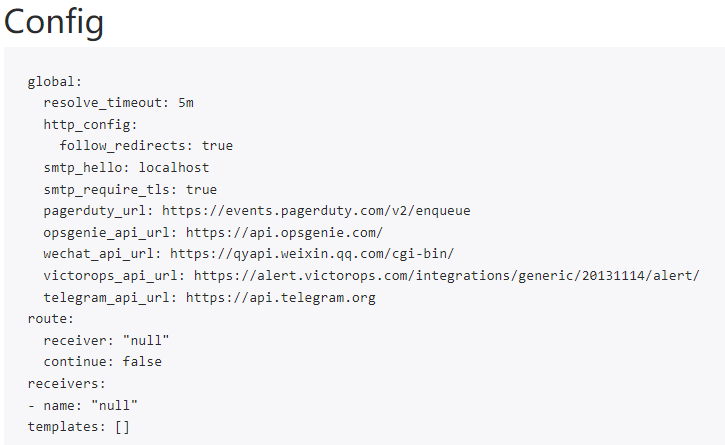
此时,我们查看alertmanager配置,可发现默认使用了最小化的配置。这个配置对于告警而言没有什么用途,需要定制化配置
配置Alertmanager
下面,我们使用AlertmanagerConfig资源来定制化配置。
- 创建AlertmanagerConfig对象,添加配置。
# alert-config.yml
apiVersion: monitoring.coreos.com/v1alpha1
kind: AlertmanagerConfig
metadata:
  name: alert-config
  namespace: demo
  labels:
    alertmanagerConfig: demo
spec:
  route:
    groupBy: ['job']
    groupWait: 30s
    groupInterval: 5m
    repeatInterval: 12h
    receiver: 'webhook'
  receivers:
  - name: 'webhook'
    webhookConfigs:
- url: 'http://example.com/'- 修改alertmanager对象,添加alertmanagerConfigSelector项,并匹配AlertmanagerConfig的label。
# alert.yml
apiVersion: monitoring.coreos.com/v1
kind: Alertmanager
metadata:
  name: alert
  namespace: demo
spec:
  replicas: 3
  alertmanagerConfigSelector:
    matchLabels:
alertmanagerConfig: demo- 现在重新登录alertmanager,可查看到配置已更新。
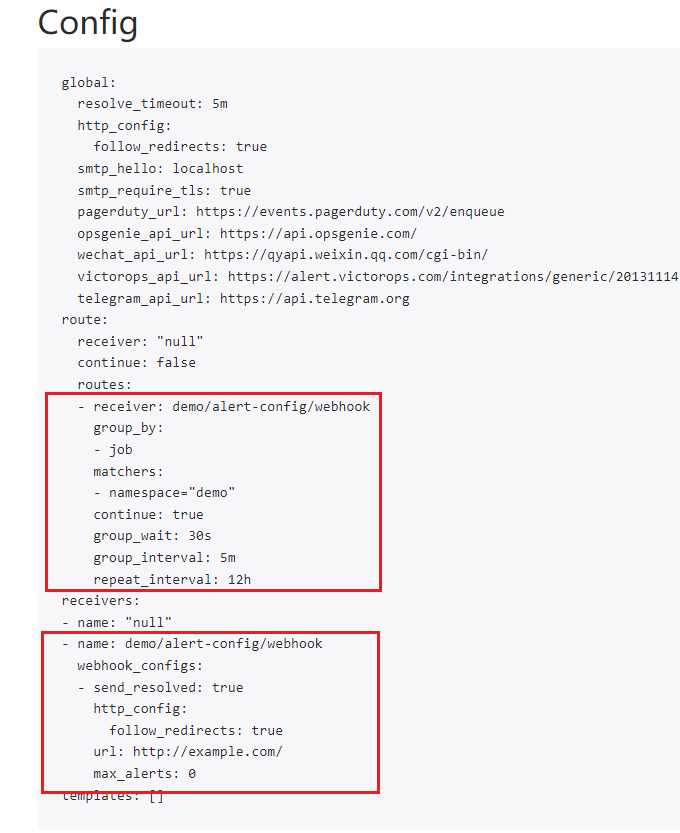
在配置好Alertmanager后,下面我们需要让Prometheus将触发的告警信息发送到Alertmanager ,并由其进行通知。
Prometheus关联Alertmanager
- 修改Prometheus,添加alerting项,指定alertmanager服务名称。
# prometheus.yml
apiVersion: monitoring.coreos.com/v1
kind: Prometheus
metadata:
  name: monitor
  namespace: demo
spec:
  serviceAccountName: prometheus
  alerting:
    alertmanagers:
    - namespace: demo
      name: alertmanager-alert
      port: web
  serviceMonitorSelector:
    matchLabels:
      group: demo
  ruleSelector:
    matchLabels:
      role: alert-rules
      prometheus: example
  resources:
    limits:
      memory: 4Gi
    requests:
      memory: 0.5Gi
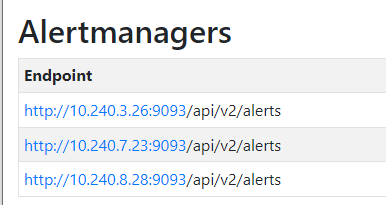
enableAdminAPI: false- 查看prometheus信息,可发现已配置相关的告警地址。prometheus在此处是基于服务自动发现方式,获取到alertmanger地址信息。
总结:
如文章如示,使用Prometheus Operator可将配置的工作进行代码化实现,从而较好的简化整个部署和管理过程,让我们得以简单高效的完成工作。 另外,这种方式也有利于我们进行定制化管理,如与第三方系统相结合来实现自动化监控,不失为一个很实用的方案。